Data talks, if you know how to make it. Journalists understand now more than ever that learning basic data journalism skills, including techniques to analyze it and turn it into visualizations, is essential to their work.
To help in this noble pursuit, the Knight Center for Journalism in the Americas is offering a new Big Online Course (BOC) for journalists interested in honing their data journalism skills.
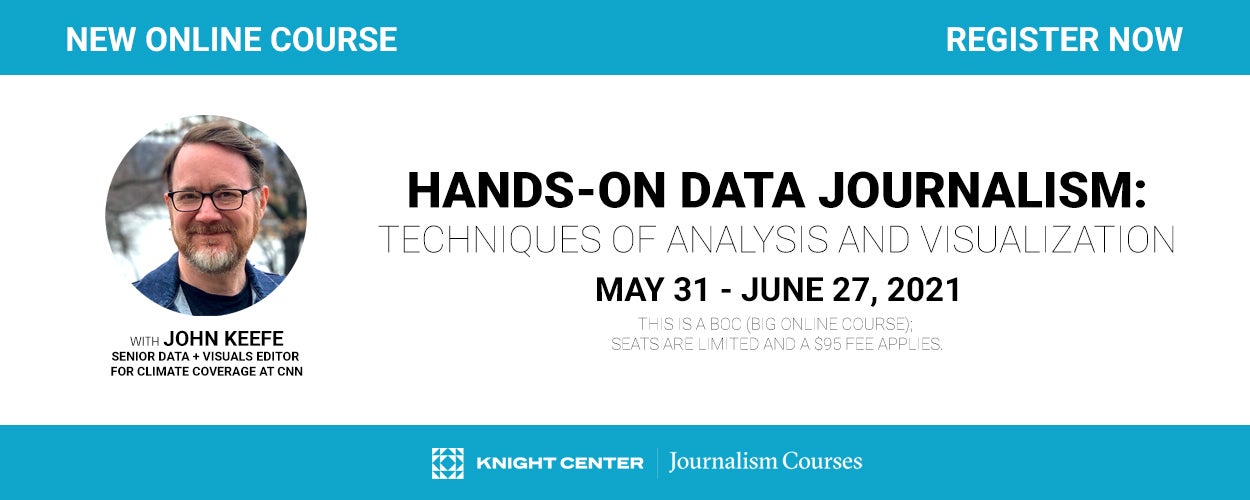
The four-week course, "Hands-on data journalism: Techniques of analysis and visualization,” runs from May 31 to June 27, 2021 and is taught by John Keefe, a leading expert and pioneer of data journalism in the United States.

Click here for more information and instructions on how to register, including how to pay online a nominal fee of U.S. $95 for this BOC, which has a limited number of spots. Unlike the Knight Center’s MOOCs, which are open courses that normally attract a few thousand people and focus on more generic and/or introductory topics, BOCs are limited to a few hundred students and focus on more specific and advanced topics. Because of the smaller course size, there is more room for interaction between students and the instructor.
"By keeping the course more intimate, I hope to be able to better address issues and questions that arise for everyone's data," Keefe said.
For this BOC, Keefe has created hands-on tutorials showing how to use free tools and specific techniques to help mine datasets for answers and stories. Students will use an example database focused on dogs, along with a dataset of their own choosing, to play with data throughout the course.
"It's the dog license database for New York City, and I love using it as an example because the idea of 100,000 pet dogs is just an easy concept to get your mind around," Keefe said. "It's a decent number of records without being too huge, it's a little messy like a lot of government data, and we get the postal codes for each dog, allowing us to do some basic geographic analysis."
Each weekly module of the course centers on using free tools to enter, explore and visualize data:
"As a whole, the people in data journalism are incredibly generous about sharing techniques and practices," Keefe said. "There is no way I would be where I am in my career today without the kindness and patience of other data journalists and journo-programmers. Through my classes, I hope to keep that spirit alive and help others to strengthen their data-driven journalism, too."
“We are delighted to have John Keefe back as an instructor for another data journalism course for the Knight Center’s distance learning program. Since the early 2000s, we have trained thousands of journalists from around the world on data analysis and visualization, including two previous courses with Keefe that were very successful,” said professor Rosental Alves, founder and director of the Knight Center.
Instructor John Keefe is the senior data and visuals editor for climate coverage at CNN. Previously, he was a graphics/multimedia editor at The New York Times, investigations editor at Quartz and senior editor for data news at public radio station WNYC, where he created its first data journalism team. He also runs a tinkering and teaching company called Really Good Smarts LLC. He has taught classes about online investigations, data journalism, machine learning and journalism products at the Craig Newmark Graduate School of Journalism at CUNY and other institutions of higher learning.
This is an all-new course, but the third time Keefe has taught for the Knight Center. Most recently, in 2019, he taught the BOC “Hands-on Machine Learning Solutions for Journalists.” The previous year, he taught the MOOC “Building Bots for Journalism: Software You Talk With,” which attracted more than 2,200 students.
Keefe will teach this new course using video instruction, presentations, readings, hands-on activities, discussion forums and quizzes. The course is open to anyone wanting to improve their data journalism skills. Basic familiarity with spreadsheets, such as Excel or Google Sheets, will be helpful. A computer with internet connection and a web browser are required.
This BOC costs $95 and includes a certificate of completion for those who fulfill all course requirements. The course is asynchronous, meaning students can complete the activities during the days and times that are most convenient. It is open to everyone, but geared toward those working in audience development.
Register today and be on your way to analyzing and visualizing data like a pro.